N-th Bézier#
Theory of Bézier Curve#
A Bézier curve is a parametric curve used in computer graphics and related fields.
It is defined by a set of discrete control points that define a smooth, continuous curve by interpolation.
The curve is defined by a polynomial function of degree n, where n is the number of control points minus one.
The curve starts at the first control point and ends at the last control point,
and the intermediate points are determined by the polynomial function.
The Lerp (linear interpolation) function is a simple function that takes two values
and a fraction between 0 and 1, and returns a value that is a linear combination of
the two values based on the fraction. For example, lerp(1, 2, 0.5) returns 1.5,
which is halfway between 1 and 2.
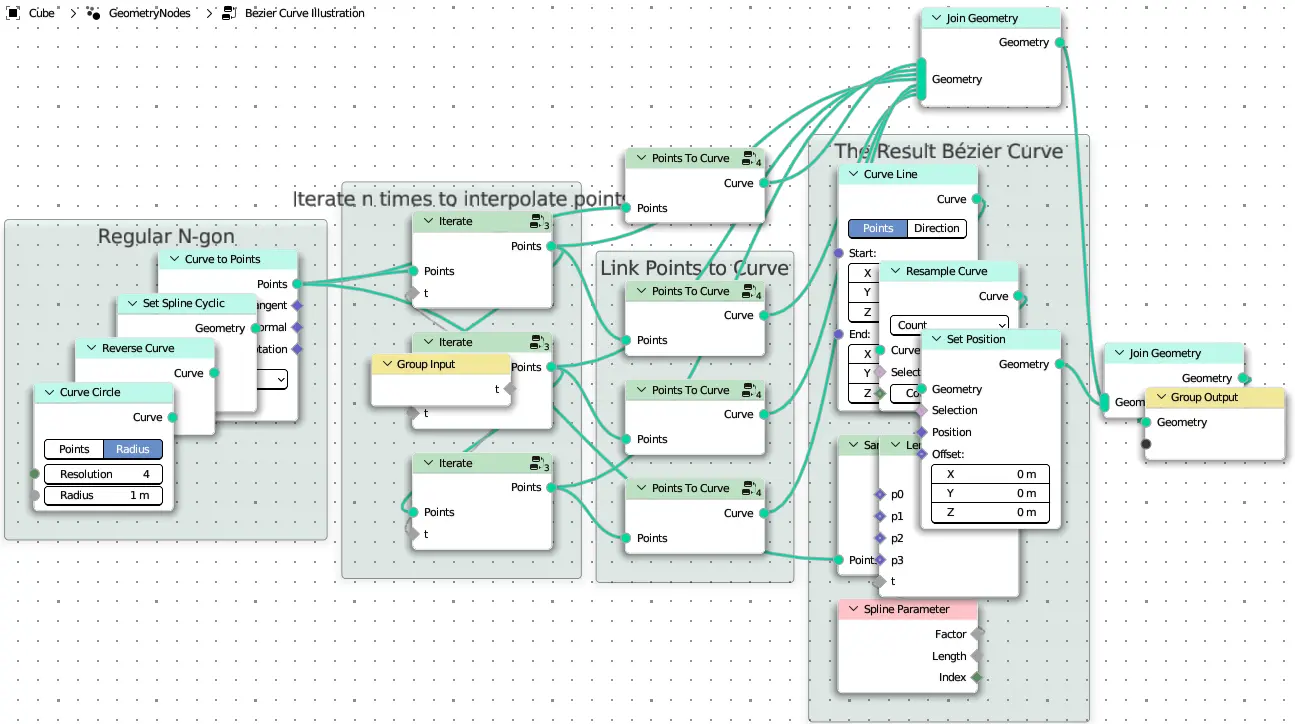
Implementation#
Bézier Curve Illustration
from pynodes import *

N = 3
n = N + 1


@tree
def sample_points_position(points: Points):

    return tuple(points.sample_vector_at_index(points.position, i)(f"p{i}") for i in range(n))


@tree
def points_to_curve(points: Points):

    position = points.sample_vector_at_index(points.position, points.index)

    curve = CurveLine().resample(points.domain_size.point_count).set_position(position)

    return curve


@tree
def lerp_1(p0: Vector, p1: Vector, t: Float = (0.33, 0, 1)):

    p = p0.mix(p1, t)

    return p


@tree
def lerp_2(p0: Vector, p1: Vector, p2: Vector, t: Float = (0.33, 0, 1)):

    m0 = lerp_1(p0, p1, t)

    m1 = lerp_1(p1, p2, t)

    return lerp_1(m0, m1, t)


@tree
def lerp_3(p0: Vector, p1: Vector, p2: Vector, p3: Vector, t: Float = (0.33, 0, 1)):

    m0 = lerp_2(p0, p1, p2, t)

    m1 = lerp_2(p1, p2, p3, t)

    return lerp_1(m0, m1, t)


@tree
def lerp_4(p0: Vector, p1: Vector, p2: Vector, p3: Vector, p4: Vector, t: Float = (0.33, 0, 1)):

    m0 = lerp_3(p0, p1, p2, p3, t)

    m1 = lerp_3(p1, p2, p3, p4, t)

    return lerp_1(m0, m1, t)


@tree
def iterate(points: Points, t: Factor = (0.33, 0, 1)):

    points_lerped = points.Points[0].delete().set_radius()

    p0 = points.sample_vector_at_index(points.position, points.index)

    p1 = points.sample_vector_at_index(points.position, points.index + 1)

    points_lerped.set_position(p0.mix(p1, t))

    return points_lerped


@tree
def change_points_position(points: Points, p0: Vector = None, p1: Vector = None, p2: Vector = None):

    points_positions = [p0, p1, p2]

    for i, position in enumerate(points_positions):

        points[i].set_position(offset=position)

    return points


@tree
def bezier_curve_illustration(t: Float = (0.33, 0, 1)):

    with frame("Regular N-gon"):

        curve = CurveCircle(1, n).reverse().set_cyclic(False)

        points = curve.to_points("EVALUATED").points

    curve = points_to_curve(points)

    with frame("Iterate n times to interpolate points"):

        points_lerped = iterate(points, t)

        points_lerped_list = [points_lerped]

        for _ in range(n - 2):

            points_lerped = iterate(points_lerped, t)

            points_lerped_list.append(points_lerped)

    with frame("Link Points to Curve"):

        curves = [points_to_curve(points_lerped) for points_lerped in points_lerped_list]

    with frame("The Result Bézier Curve"):

        points_positions = sample_points_position(points)

        bezier_curve = CurveLine().resample(32).set_position(globals()[f"lerp_{n-1}"](*points_positions, curve.parameter.factor))

    return curve.join(*curves, *points_lerped_list) + bezier_curve